Sep 17, 2026
How to Read a Nano Insulation Board Datasheet: Seven Numbers and What They Actually Mean
A buyer's guide to the property sheet — why classification temperature is a test outcome rather than a service limit, why a conductivity figure without a mean temperature is only half a number, what d
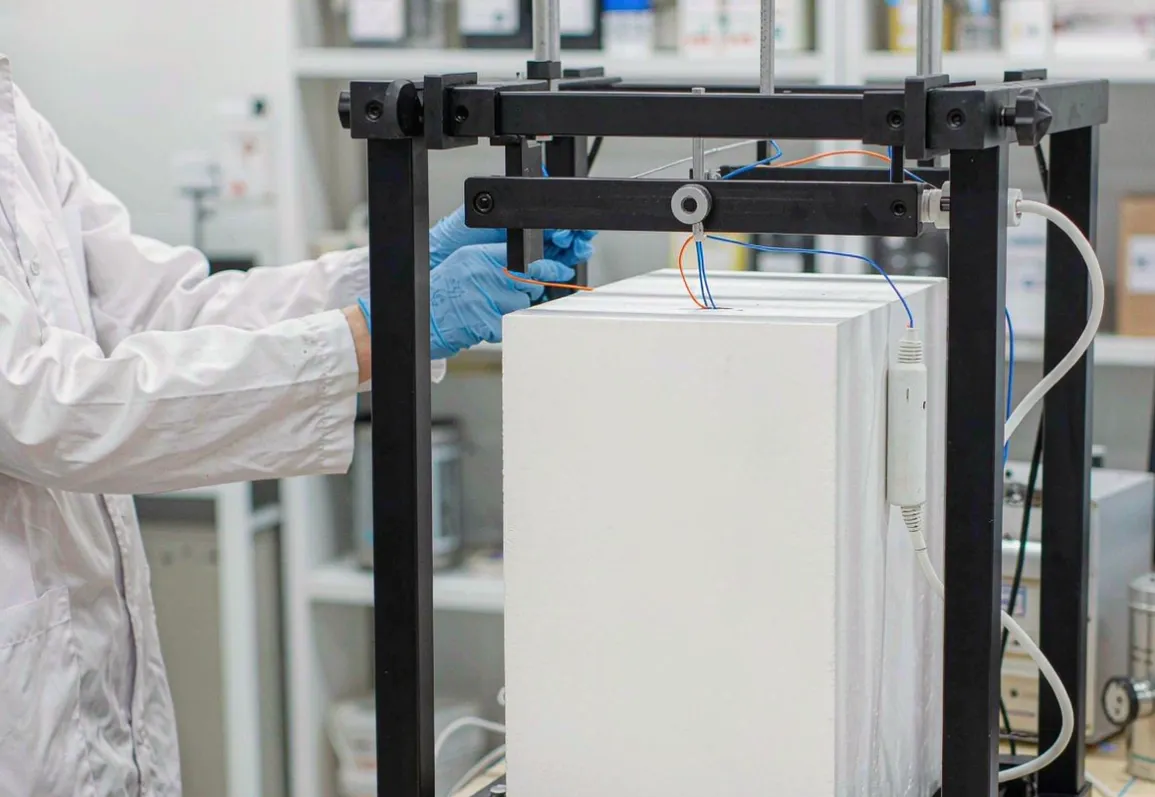
A property sheet for microporous board looks like a specification, but it is not one. It is a set of measurements taken under specific conditions, and when the conditions are left out — which they often are — the numbers stop being comparable. Two suppliers can both be telling the truth and still be describing materials that behave nothing alike in a ladle.
The supplier audit checklist covered the questions to ask a vendor before you buy. This one is the other half: how to read the answers once they arrive, and how to spot the line items that quietly decide whether a lining lasts sixty heats or two hundred.
Why two honest data sheets can disagree
Most disagreements between data sheets are not lies. They are different test conditions reported as if they were the same fact.
Thermal conductivity of a microporous board is not a constant — it rises with temperature. Density depends on how the board was pressed and what it was pressed from. Shrinkage depends on how long the sample was held at temperature. Change any of those conditions and you get a different, equally honest number.
So the first habit to build is not "compare the numbers." It is "compare the conditions behind the numbers." A figure with no stated test condition is not a weak number, it is an incomplete one — and you should treat it as unknown until the supplier fills in the blank.
1. Classification temperature — a test outcome, not a service limit
This is the single most misread line on the sheet, and it is usually the one printed largest.
Classification temperature is the temperature at which a sample, held for a defined period, stays within a defined permanent shrinkage — conventionally 2 percent after 12 hours. It tells you the board did not deform badly in that test. It does not tell you the board is designed to run there continuously.
In practice the continuous service temperature sits meaningfully below the classification temperature. How far below depends on the grade and on whether the board is under load, in contact with a hotter working lining, or exposed to thermal cycling. A back-up layer that sees a working lining at 1500 C is not running at the working lining temperature, but it is not running at ambient either, and where it sits on that gradient is exactly the calculation the thickness sizing method walks through.
The practical consequence: if you size a grade by classification temperature alone, you will specify a board that spends its whole campaign near its own limit. Where the mean service temperature runs above 1000 C, SLM-1200 is the grade to specify; the SLM-1000 vs SLM-1200 comparison guide sets out where the rating boundary actually falls and why the grades exist separately.
What to demand in writing: the holding time, the shrinkage limit, and the standard the test was run to. "Rated to 1200 C" with none of those three is marketing.
2. Thermal conductivity — the mean temperature is half the number
A conductivity figure without a mean temperature is not a data point. It is half of one.
Microporous board performs well because its pore structure is smaller than the mean free path of air molecules, which suppresses gas conduction. That advantage does not disappear at temperature, but it erodes as radiant heat transfer through the solid skeleton starts to contribute more. The result is a conductivity curve that climbs — the value at 200 C mean and the value at 800 C mean are genuinely different materials from the thermal designer's point of view.
Three things to check on this line:
The mean temperature. Ask for the curve at 400, 600 and 800 C mean, not a single value. If a supplier quotes one number, ask which mean temperature it belongs to — the answer is usually the most flattering one available.
The test method. Guarded hot plate and heat flow meter produce defensible but not identical results, and the difference is large enough to matter when you are comparing two sheets side by side.
The direction. Pressed board can be slightly anisotropic. Minor for most ladle geometries, worth knowing if you are modelling rather than estimating.
A conductivity curve also tells you something the supplier may not intend: how flat it is. A board whose conductivity climbs steeply with temperature is a board that loses much of its advantage in the hot zone, and no amount of room-temperature performance will bring that back. The high-strength nano insulation boards product page publishes the full curve rather than a headline figure for exactly this reason.
3. Density — read it against the thickness, never alone
Density for this class of material typically runs 220 to 300 kg per cubic metre. Within that band, denser is not better and lighter is not cheaper — they are different trade-offs.
Higher density generally buys compressive strength and handling robustness, and slightly worsens conductivity because there is more solid skeleton to conduct through. Lower density improves the thermal figure and makes the board more fragile in transit and more prone to edge damage during cutting.
Two traps on this line:
The single-figure trap. A density quoted as one number with no tolerance is a target, not a capability. Ask for the measured range across recent batches. A board that varies more than about 10 percent batch to batch will make your thickness stack-up unpredictable, and that is where thermal performance quietly drifts away from the design.
The pricing trap. Board sold by weight and board sold by area reward opposite behaviour. If two quotes differ, convert both to cost per installed square metre at the thickness you actually need before deciding which is cheaper — this is the same arithmetic that makes How SLM nano insulation boards are manufactured worth reading, because the pressing step is where density and consistency are actually set.
4. Permanent linear change — the number that predicts your failure mode
If you read only one line for diagnostic value, read this one.
Permanent linear change (sometimes "reheating linear change") is the shrinkage the board undergoes after being held at temperature. It is the direct, measurable cause of the failure mode where a teardown finds high-strength nano insulation boards that have pulled away at the joints, leaving open gaps that bypass the insulation entirely and put a hot streak on the shell.
Read it as a curve, not a point: shrinkage at 800 C, at 1000 C, at 1200 C. A board that is stable to 1000 C and then shrinks hard at 1100 C has told you precisely where its ceiling is — and if your back-up layer can reach that temperature during a campaign upset, you now know what the teardown will look like.
This is also the number to quote back when someone argues that a hotter-run board "should have survived." If the board exceeded its stated permanent-change limit, it did not fail. It was operated beyond its specification.
5. Compressive strength — you want enough, not more
Compressive strength on a back-up insulation board is a handling specification, not a structural one. The board is not carrying load; the steel shell is.
What you actually need is enough strength to survive cutting, transport, and being clamped behind anchors without crumbling at the edges. Beyond that, higher compressive strength tends to come from higher density, which costs you conductivity — you are paying thermal performance for strength you will not use.
The useful question is therefore the reverse of the usual one: not "how strong is it" but "what is the lowest density grade that survives my handling and anchoring method." That is a question your own installation crew can answer empirically in an afternoon, and it usually points to a cheaper and thermally better board than the one the datasheet ranking suggests.
6. Loss on ignition — what leaves the board on first heat
Loss on ignition measures the mass that burns or volatilises out of the board when it is first heated. In practice it is binder residue and processing volatiles.
This line gets skipped constantly, and it is the one that explains first-heat problems. A board with meaningful LOI is going to release that mass as gas during the initial heat-up, and if the heating rate through the relevant band is too fast, the gas has nowhere to go except through the joint structure — which is one documented route to early spalling.
That is why the preheat and dry-out curve has two slow zones rather than a single ramp: the low-temperature band removes adsorbed moisture, and a higher band deals with what comes out of the binder. LOI tells you roughly how much has to come out, and therefore how much care the second band deserves.
If a data sheet omits LOI entirely, assume nothing and follow the conservative curve.
7. Moisture and dimensional tolerance — the two lines buyers skip
Moisture content at dispatch. Microporous material is hygroscopic. Board that has been stored badly, or shipped without effective vapour barrier, arrives carrying water that will turn to steam in the first heat-up — the same failure mechanism as a rushed dry-out, arriving before anyone has done anything wrong. This is the first thing the incoming inspection protocol checks, and it is the one that turns into a claim if you do not record it on arrival.
Dimensional tolerance. Plus or minus 1 mm on a 50 mm board is achievable and worth asking for. Wider than that and your joint layout has to absorb the variation, and joints are where heat leaks and where gaps open up after shrinkage. Tolerance on length and width matters less than tolerance on thickness, because thickness sets the thermal resistance and stacks multiplicatively across a layered assembly.
What a complete data sheet should contain
Set this against whatever you have been sent:
Classification temperature with holding time, shrinkage limit and test standard
Thermal conductivity as a curve at multiple mean temperatures, with method named
Density as a range, not a target
Permanent linear change at three or more temperatures
Compressive strength at a stated deformation (10 percent is conventional)
Loss on ignition
Moisture content at dispatch, and the packaging that protects it
Dimensional tolerances for thickness, length and width
Batch number traceability linking the sheet to a certificate of analysis
Missing entries are information too. A supplier who publishes eight of these nine has done the testing; a supplier who publishes four is asking you to accept the rest on trust. What to do with a partial sheet is covered in the supplier audit checklist.
What to do with all this
Print two or three sheets, put them side by side, and normalise them before you compare anything: same mean temperature, same units, same stated conditions. In most cases two of the three will stop looking different once you do that, and the third will reveal itself as the one worth the price premium — or as the one to drop.
None of this requires a laboratory. It requires refusing to compare numbers whose conditions you have not read.
For the full curves and batch-level values on our own grades, start with the high-strength nano insulation boards page, or see how a complete back-up assembly is built up in practice on the anchored ladle back-up assembly page. If you want a second read on a data sheet you have been sent, send it over — we will tell you which lines are load-bearing and which are decoration.
Questions on grades, thickness or a specific shell-temperature target: sales@slmthermal.com