Sep 21, 2026
Proving the Payback: How to Verify Nano Insulation Board Performance After Installation
How to prove a nano back-up layer actually delivered: the baseline numbers to fix before first heat, the IR shell survey method and the signatures that matter, an honest way to compare energy per heat
The relining is finished, the ladle is back in service, and somewhere between the shop floor and the next budget meeting the question will arrive: did the insulation upgrade actually deliver? If nobody planned the answer before the first heat, the question gets settled by anecdote — a colder shell "somewhere near the trunnion", a gas bill nobody can decompose, a feeling. That is a poor way to justify any capital decision, and an unnecessary one, because verifying a back-up insulation layer is straightforward if you set it up while the boards are going in.
The purchase was justified by the ROI model built around shell losses and cycle time. This article is the other half of that discipline: what to measure, when to measure it, and what "good" looks like on each instrument.
Before first heat: fix the baseline
Verification is a comparison, and a comparison needs a defined baseline. Three numbers are worth fixing before or at the moment of the changeover:
Shell temperature at named points. Trunnion level, slag line, barrel bottom, and anywhere the old lining ran hot. Written down, with the ambient temperature and the camera settings used.
Specific energy per heat (or per tonne), from the gas meter or electrode data, averaged over a defined recent window.
The predicted cold-face temperature from the design calculation. The thickness sizing guide produces this number as its output; verification is, at bottom, checking reality against it.
If no pre-installation baseline exists, the first month after installation is still usable — compare against an adjacent ladle on the old lining, or against the same ladle's pre-upgrade history with the season and production mix held in mind. It is weaker evidence, not worthless evidence.
The shell temperature survey
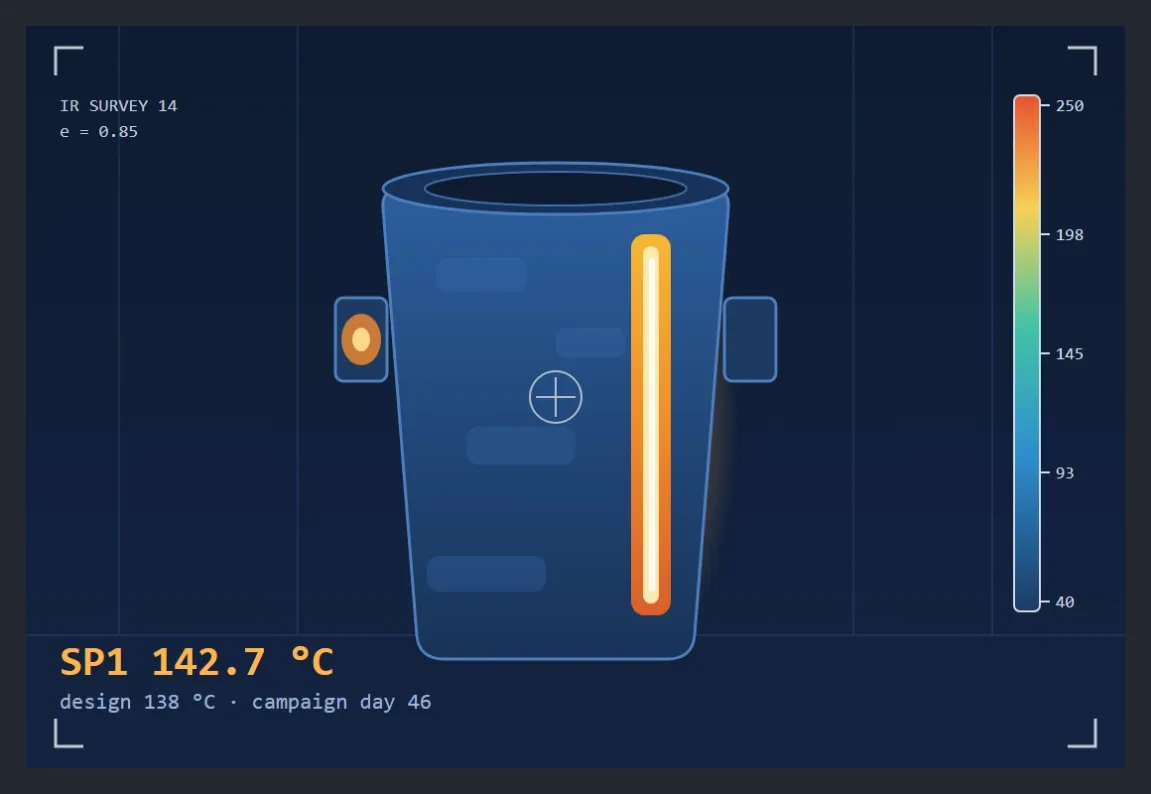
The instrument that sells this upgrade internally is an IR camera, because the result is a picture.
Method matters more than hardware. Survey after the lining has reached thermal steady state — a handful of heats in, not straight after dry-out. Use the same emissivity setting every time (oxidised cast steel sits around 0.80 to 0.90; the exact value matters less than keeping it constant), compensate for reflected ambient, and shoot from consistent distances and angles. Archive the thermal image for every survey point, every time, so each campaign stage has a comparable record instead of a phone album.
What good looks like:
A cold, uniform shell. Most of the barrel reading within ten to fifteen degrees of the predicted cold-face temperature, no isolated islands.
No streaks. A vertical hot streak is the signature of a joint gap or a board that shifted — precisely the failure mode the failure analysis guide documents from teardowns. Caught during the campaign, it is a maintenance mark; caught late, it is a teardown finding.
A stable trend. The most useful output is not one survey but the series. Re-survey at defined campaign intervals and watch for drift upward, which is how shrinking boards and opening joints announce themselves months before the shell discolours.
One caution on interpretation: a hot spot is a symptom with several possible causes, and the camera localises it but does not diagnose it. Growing spot, stable spot, spot that appears only late in the campaign — each points somewhere different, and jumping to a relining decision on the first image wastes the diagnosis.
Energy numbers: the honest comparison
Energy is where the payback lives, and also where wishful thinking lives, so define the comparison tightly.
Compare specific consumption per heat across similar production windows: same season, comparable steel grades, similar tap-to-tap patterns. Shell losses are a fraction of total energy input, so the honest expectation is a single-digit to low-teens percentage change in specific consumption — not a transformation of the furnace's appetite. If someone quotes a thirty percent total-energy saving from back-up insulation alone, the claim has drifted from shell losses to everything, and it will not survive the utility bill.
Two adjustments keep the series honest. First, exclude the dry-out and early heats from the performance claim: the preheat and dry-out curve deliberately spends extra fuel early to remove moisture, and those heats say nothing about steady-state performance. Second, normalise for production: energy per tonne, not energy per day, because a slow month looks like a savings month otherwise.
Fuel-fired and electric installations see the benefit differently. On gas-fired heating, reduced shell loss shows up directly in gas per heat and in faster, cooler preheat cycles. On arc furnaces the signal is noisier, and holding losses — ladles waiting full — are often where insulation quietly pays best.
What the numbers will not show
Three benefits never appear in a per-heat energy series, and it is worth saying so out loud when presenting results.
Lining life. A cooler working lining typically extends campaign length, but that shows up as refractory cost per tonne across months, not as an immediate energy delta. Cycle time. A shell that radiates less cools slower between heats, which shortens reheating — visible only if someone records it. And safety/comfort: lower shell temperature changes the working environment around the ladle in ways operators notice before instruments do.
The achievable figures also depend on the grade in the wall. Where the back-up layer faces sustained mean temperatures above 1000 C, the SLM-1200 grade holds its conductivity advantage that a lower-rated material cannot, and the verification targets should reflect which grade was actually installed — the numbers to compare against are on the product page's conductivity curve, not on a generic brochure figure.
When the numbers disappoint
A verification that misses its target has a short list of suspects, and the survey usually ranks them:
Joint gaps — hot streaks on the shell at predictable locations; re-check against the jointing rules in the ladle installation guide.
Wet boards — elevated consumption early in the campaign that fades as the lining dries; trace back to arrival condition and the incoming inspection records.
Thickness shortfalls — cold face warmer than predicted everywhere, not in spots; check what was actually installed against what was specified.
Board shrinkage — cold face creeping up over the campaign; confirmed at teardown.
Each of these has a different owner and a different remedy, which is exactly why the verification data should be kept per-campaign and per-ladle: the file that proves performance is the same file that diagnoses it.
Keep the file
The deliverable of verification is not a meeting slide — it is a per-campaign record: survey images with dates and settings, the energy series with its normalisation notes, and teardown findings when the campaign ends. The next order, the next thickness decision, and the next negotiation all draw on it, and the batch paperwork retained from the incoming inspection is what links the file to a specific supply.
If you are setting up a verification programme and want realistic targets for a given thickness and grade, write to us with your operating temperatures — we will tell you what the cold face should read and what the survey should show before you spend the first heat on it.
To see the assemblies these surveys are shot against, the anchored ladle back-up assembly page shows the build-up in place.
Questions on grades, verification targets or a specific shell-temperature goal: sales@slmthermal.com